
Farm water as infrastructure for the AI age
Data centres and farms are starting to draw on the same watersheds. What a shared, measured water ledger could look like — and who would pay for it.
Water quantityComputeResource allocation
Perspectives
Working papers, models, and points of view from the TerraValue team — on natural capital, farm economics, and the markets we are building toward. Each one shows its data so you can argue with it.
What if every acre paid its steward a recurring dividend for the clean water, carbon, and habitat it produces — funded by the people who benefit? A proposal, a model, the numbers behind it, and what one Nebraska field actually produces.
Read the working paper →
6%
reference carbon revenue as a share of the societal-value benchmark
$42/acre
proposed annual steward payment under the base scenario
4.3×
modeled stewardship acres in 2040 relative to the modeled status quo
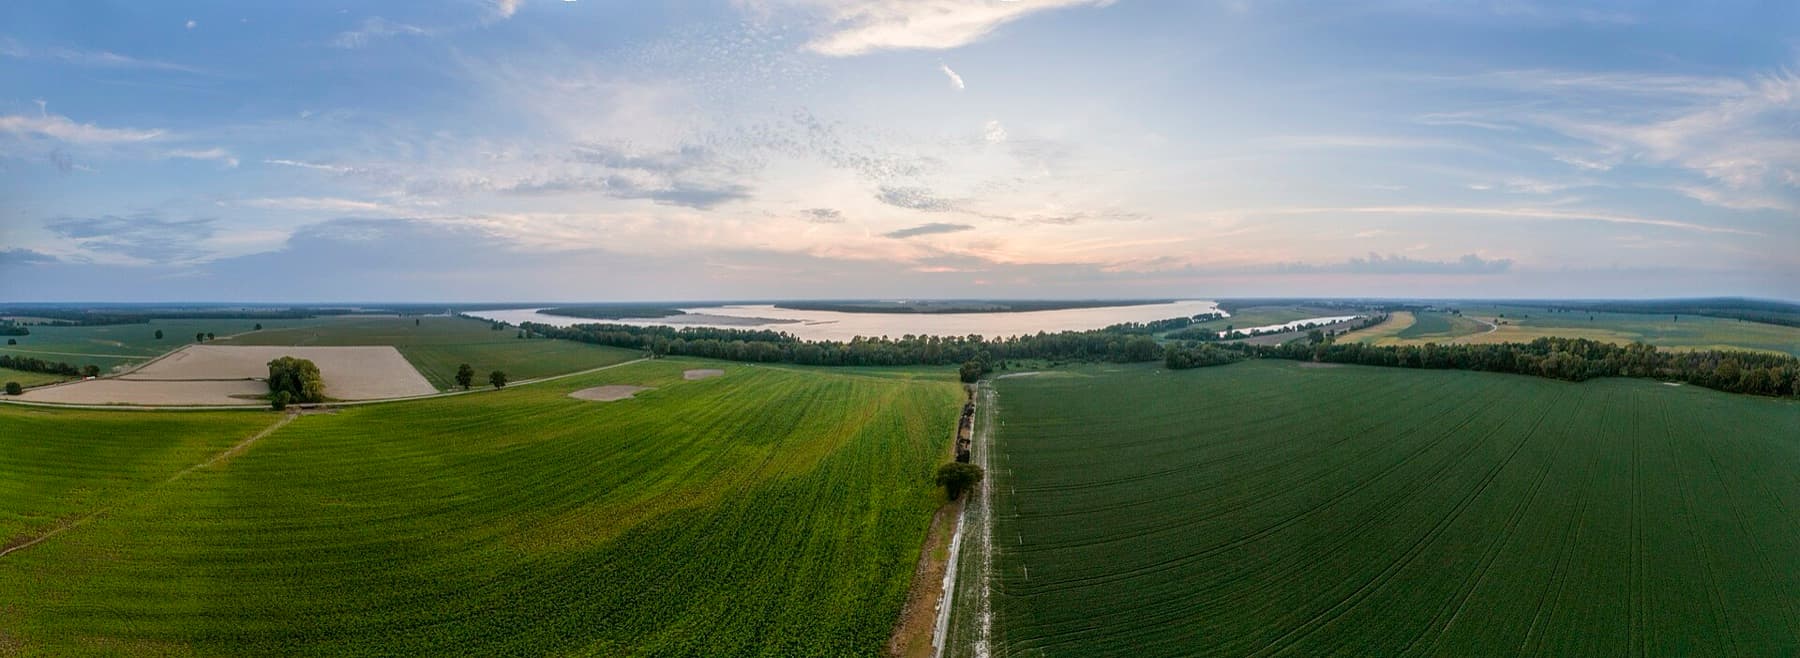
One field can create value for a whole community. Explore who could help pay for its stewardship, follow the money, and test what makes an offer work for the farmer.
October 21, 2026 · 12 min read
Read the working paper →
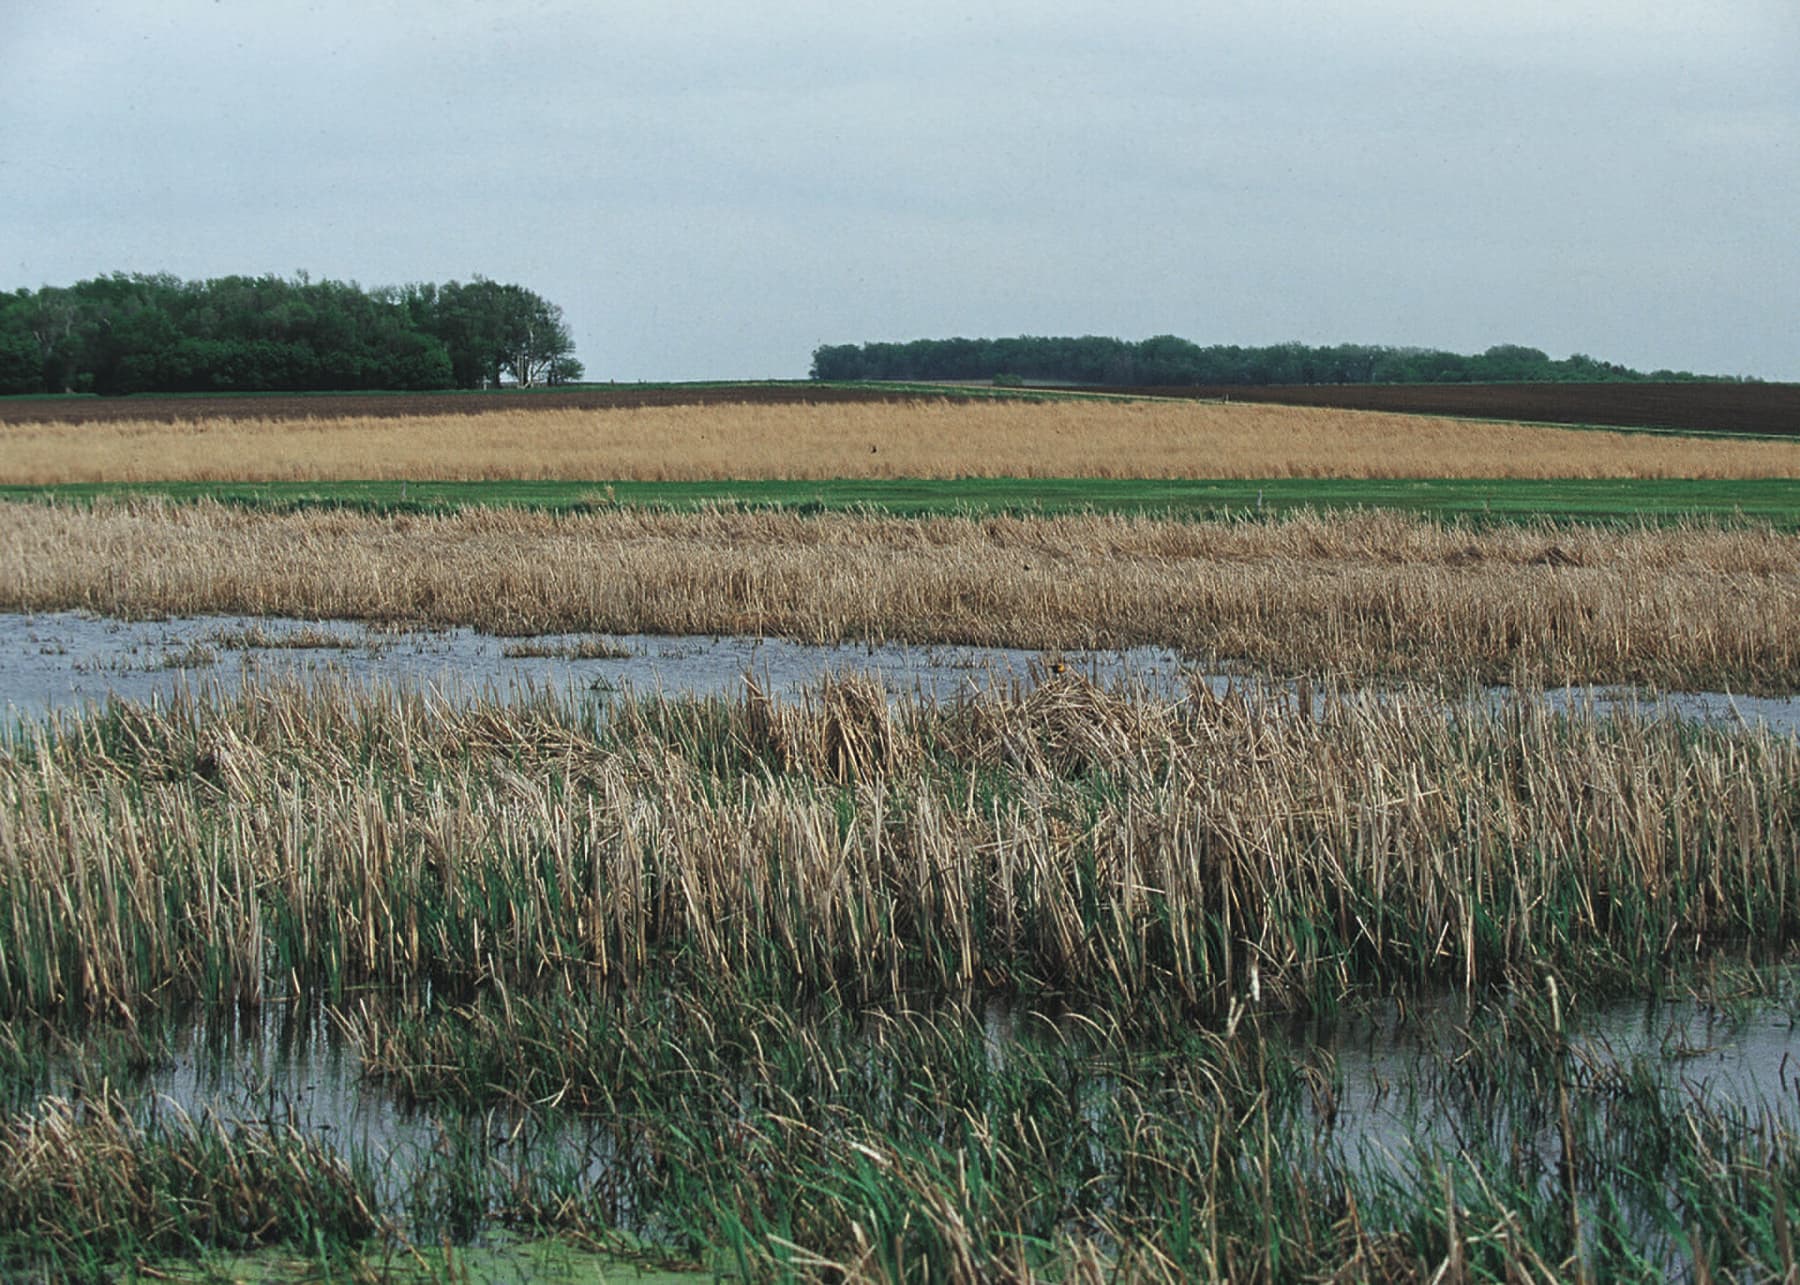
How restructuring risk and revenue can change a farm decision, the fate of water, nutrients and carbon, and the impact on people downstream. Published dollars, emerging programs and four interactive figures.
October 22, 2026 · 10 min read
Explore the perspective →
In research
Data centres and farms are starting to draw on the same watersheds. What a shared, measured water ledger could look like — and who would pay for it.
FAO puts agrifood’s hidden costs above $10 trillion a year. What it would take to run that accounting at the level where decisions are actually made.
How we write these
Every figure links to its source. Reported numbers and projections are drawn differently.
Each assumption is tagged as published data, a derivation, or a design choice we are proposing.
Where a paper uses a model, interactive charts run from its tested calculations so you can change an input and see what moves.
These are positions, not conclusions. The fastest way to improve them is for someone to tell us where they are wrong.